



Bull Flag vs Bear Flag: Continuation Patterns Compared with Charts
Bull flag pattern and bear flag pattern are classic continuation patterns used in crypto technical analysis. This guide compares their formation rules, volume behavior, measured-move targets, and reliability data.
Anatomy of a Bull Flag
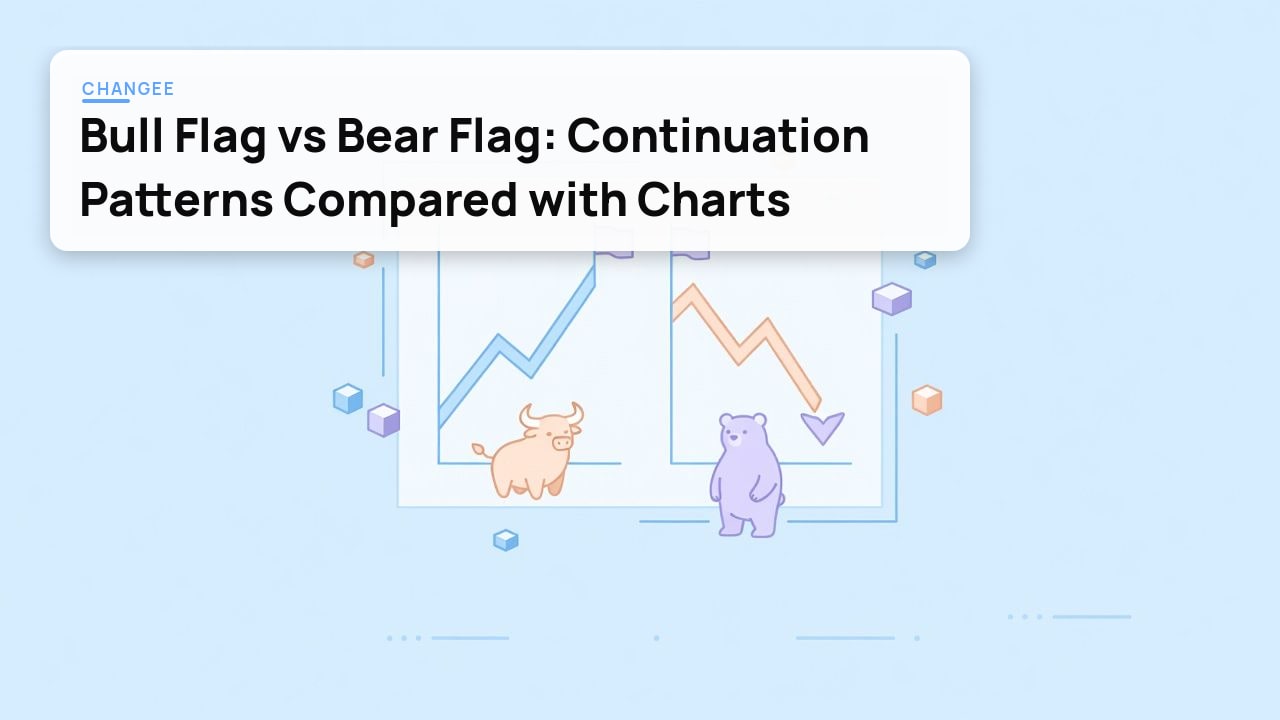
A bull flag is a continuation pattern that appears during an established uptrend. It begins with a sharp upward price surge known as the flagpole. This move typically occurs on elevated volume as buyers drive prices higher quickly.
Following the flagpole, price enters a brief consolidation phase that forms the flag itself. The flag consists of a short downward-sloping or sideways channel bounded by two parallel trendlines. These lines connect successive lower highs and lower lows, creating a rectangular or slightly angled shape that slopes against the prior trend.
Volume behavior distinguishes the pattern. Trading activity spikes during the flagpole formation, then contracts noticeably while price consolidates within the parallel boundaries. This reduction in volume signals temporary indecision rather than reversal pressure.
The retracement within the flag remains limited. According to standard technical descriptions, the pullback does not exceed the midpoint of the flagpole height, preserving the overall uptrend structure. Any deeper correction would invalidate the pattern.
Breakout confirmation occurs when price closes above the upper trendline of the flag on expanding volume. This resumption of buying interest typically leads to a measured move projection equal to the flagpole length added to the breakout point, though actual outcomes vary by market conditions and timeframe.
Anatomy of a Bear Flag
A bear flag forms as the mirror image of its counterpart during a prevailing downtrend. It begins with a sharp downward price move known as the flagpole, which establishes the primary bearish momentum. After this decline, the price enters a brief consolidation phase that creates the flag itself, typically taking the form of an upward-sloping channel or a sideways rectangle bounded by parallel trendlines.
Volume behavior follows a distinct pattern: participation spikes during the flagpole formation, then contracts noticeably while the flag develops, reflecting reduced selling pressure in the short term. The retracement within the flag stays limited, generally not exceeding the midpoint of the preceding flagpole. Breakdown confirmation occurs when price closes below the lower boundary of the flag on expanding volume, signaling resumption of the original downtrend.
These patterns remain short-term in nature, often spanning a few days to three weeks on daily charts across assets including stocks and crypto. The measured-move objective is derived by projecting the flagpole length downward from the breakdown point, providing a concrete price target once the structure completes.
Bull Flag vs Bear Flag: Key Differences
| Aspect | Bull Flag | Bear Flag |
|---|---|---|
| Trend direction | Uptrend, forms after sharp upward flagpole move | Downtrend, forms after sharp downward flagpole move |
| Flag slope | Downward-sloping or sideways consolidation bounded by parallel trendlines | Upward-sloping or sideways consolidation bounded by parallel trendlines |
| Volume sequence | Higher on flagpole, contracts during consolidation, expands on breakout | Higher on flagpole, contracts during consolidation, expands on breakdown |
| Target calculation method | Project flagpole height upward from breakout point | Project flagpole height downward from breakdown point |
| Typical duration | Few days to three weeks on daily charts | Few days to three weeks on daily charts |
| Market-context success rates | 64% target completion in bull markets (Bulkowski via ThinkMarkets, referenced October 23, 2025); ~67% in one 2021 multi-market study | Zero failure rate in bear markets with minimum 5% gain (Bulkowski via ThinkMarkets); ~67% in one 2021 multi-market study |
Bull flags require confirmation via breakout above the upper trendline with rising volume, while bear flags need a breakdown below the lower boundary. Both limit retracement to roughly 50% of the flagpole to maintain validity. Context matters: bull flags perform best in established uptrends and risk failure if the broader market turns bearish. Bear flags show stronger reliability in confirmed downtrends according to the cited studies, yet traders must still watch for volume confirmation to avoid false breakdowns. These distinctions help filter setups when scanning assets across sectors.
Reliability Data and Success Rates
Thomas Bulkowski’s studies, referenced in an October 23, 2025 ThinkMarkets article, show bull flags completing measured-move targets 64 percent of the time in bull markets. Bear flags in bear markets recorded a zero failure rate, with every tested trade delivering at least a 5 percent gain in stocks. Flags remain short-term formations, typically lasting days to three weeks on daily charts.
A 2021 TradingView study across multiple markets found roughly 67 percent success for both bull and bear flags on daily timeframes. Other analyses place reliability between 47 and 75 percent, depending on market regime and the precise definition of a valid flag. No single consensus figure exists because results shift with volume confirmation, trend strength, and the chosen stop-loss placement.
These percentages apply to equities yet offer useful context for crypto traders who adapt the same measured-move rules. Traders should therefore combine pattern recognition with higher-timeframe trend alignment and volume expansion on breakout rather than relying on any fixed success rate.
Applying Flags in Crypto Markets
Cryptocurrency charts display bull and bear flags on timeframes ranging from intraday intervals for short-term scalpers to daily and weekly charts for swing positions. The May 13, 2026 Phemex academy update stressed the patterns’ continued relevance for crypto trading in 2026, underscoring the need for volume confirmation alongside higher-timeframe trend alignment.
Confluence with a higher-timeframe direction improves reliability, while volume expansion on the breakout or breakdown provides the key confirmation signal. A September 1, 2026 YouTube analysis observed Bitcoin forming bear flags into resistance amid prevailing price action, showing how these short-term structures, typically lasting a few days to three weeks on daily charts, appear in volatile crypto environments.
FAQ
How do I identify a bull flag on a chart?
Look for a sharp upward flagpole followed by a short downward-sloping or sideways consolidation bounded by parallel trendlines. The retracement should stay under 50 percent of the flagpole before a breakout above the upper line.
What is the measured-move target for flag patterns?
Project the full flagpole height upward from the breakout point in a bull flag or downward from the breakdown point in a bear flag to set the price objective.
What signs show a flag pattern is failing?
Watch for volume that fails to expand on the breakout, a close back inside the flag boundaries, or price moving beyond the 50 percent retracement level of the flagpole.
How important is volume during flag formation?
Volume is typically highest on the flagpole, contracts during consolidation, and expands sharply on the breakout or breakdown. This sequence confirms participation and pattern validity.
Which timeframes suit flag trading best?
Flags appear on daily charts and shorter intervals, usually lasting a few days to three weeks. Higher-timeframe confirmation improves reliability in crypto markets.
Can flags be combined with other indicators?
Traders often add moving averages for trend direction or RSI for momentum checks at breakout. Volume confirmation remains the primary filter according to pattern studies.
What success rates do bull and bear flags show?
Bulkowski data referenced by ThinkMarkets shows bull flags reaching targets 64 percent of the time in bull markets, while bear flags in bear markets posted zero failures with at least a 5 percent gain in stocks.